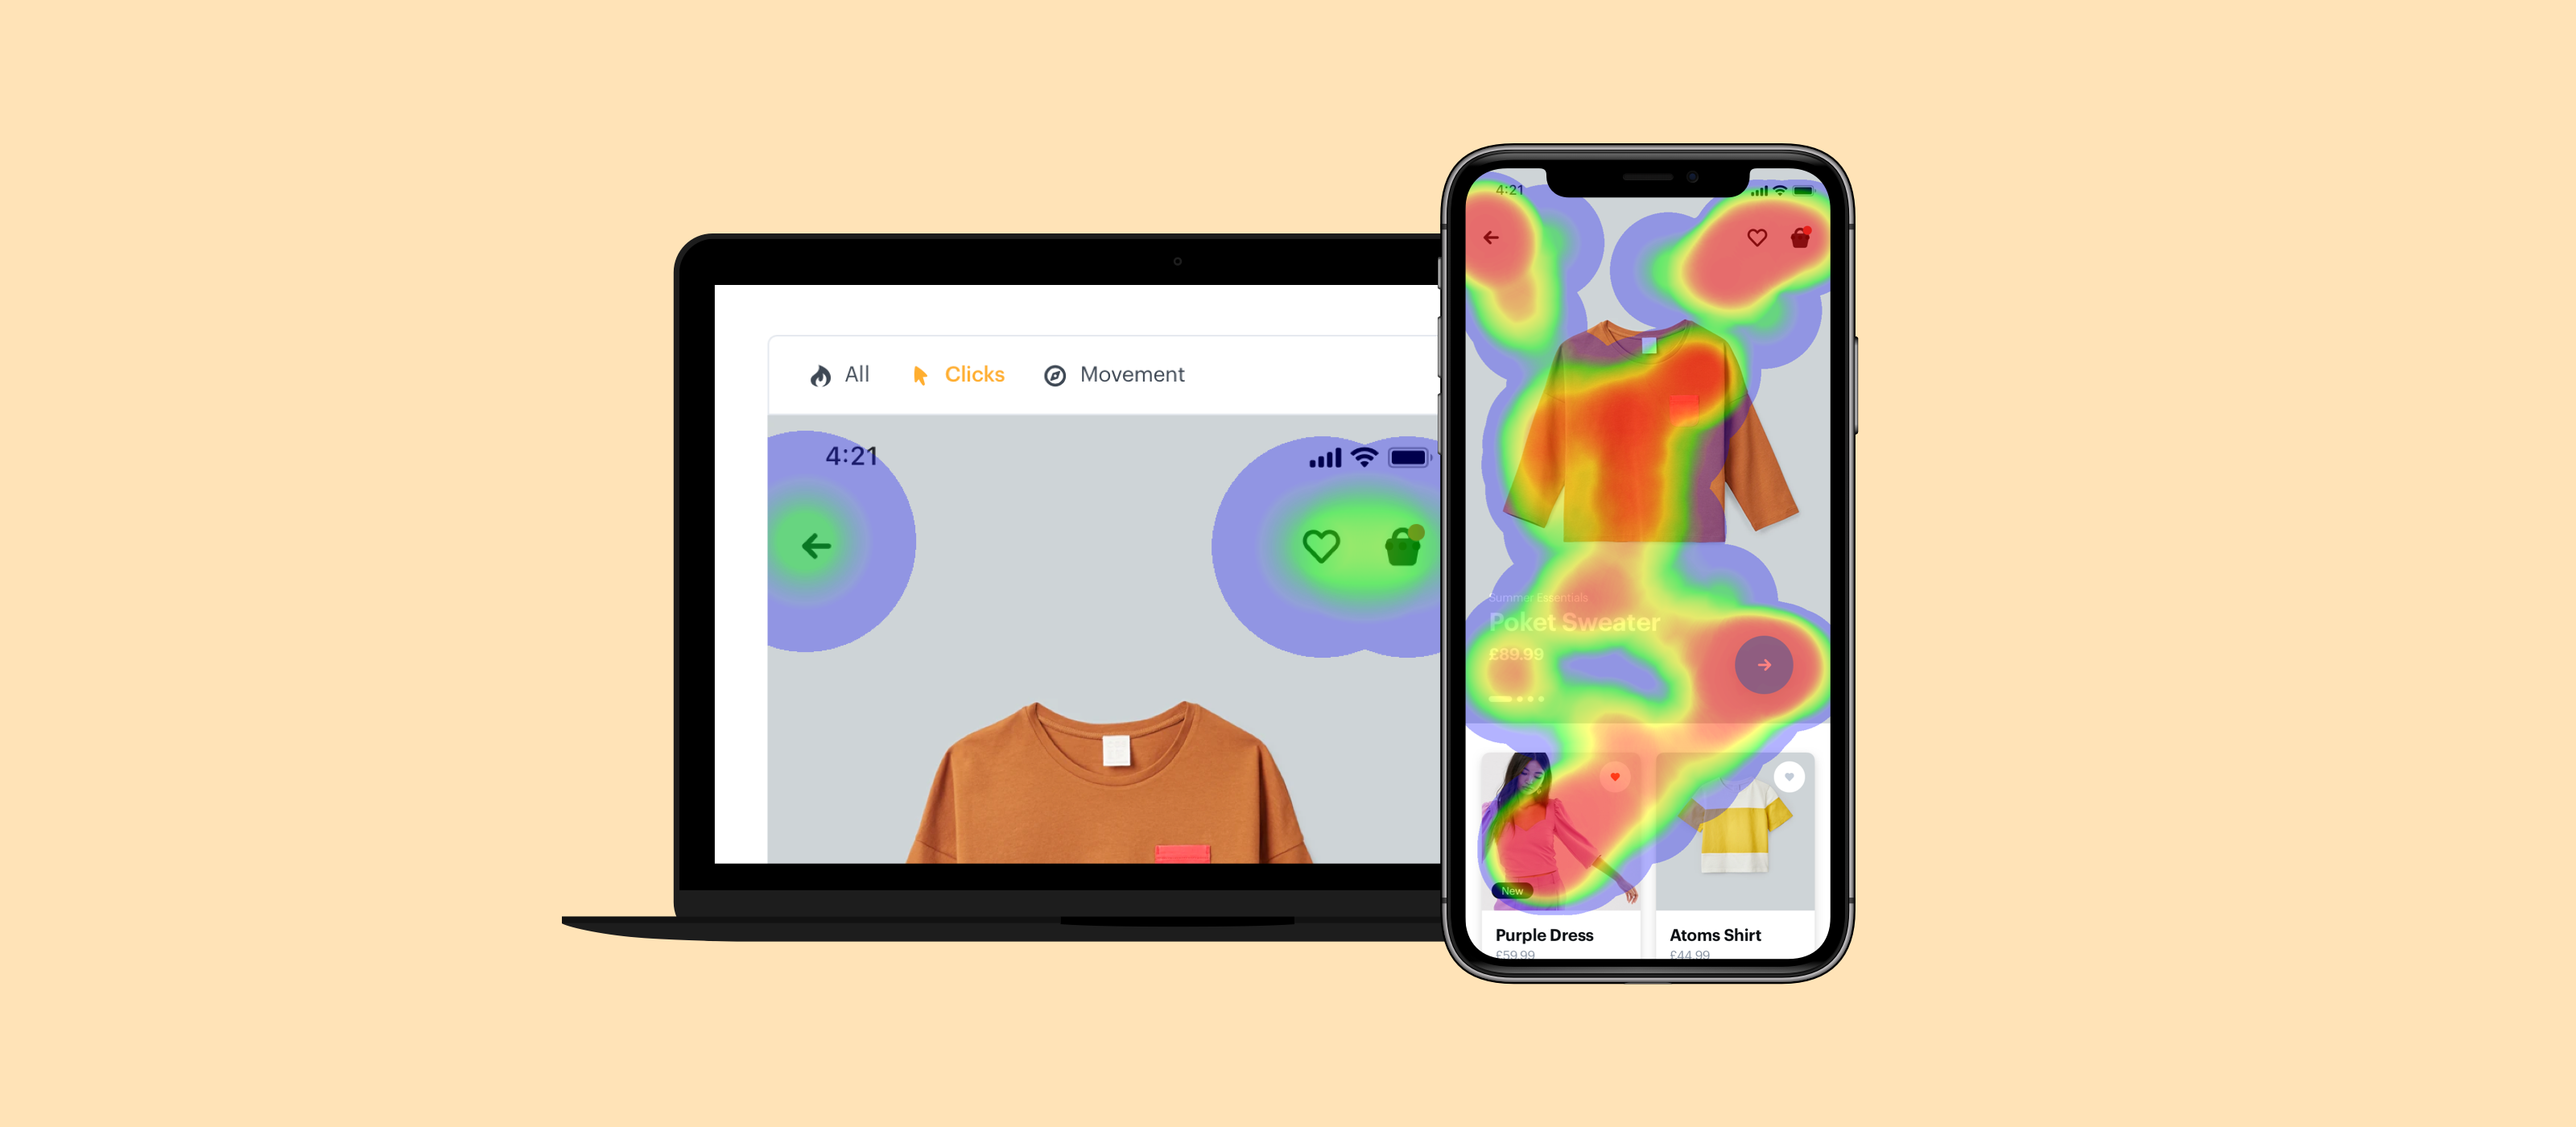
Last year we launched our powerful User Testing features, which enable you to record and analyse how users interact with your prototypes so you can optimise your designs based on customer insights. As well as capturing video and audio feedback, Marvel's User Testing tools can also record the screen to reveal how users move through each design in your prototype.
Today we're excited to launch a new addition to our user testing suite - Heatmaps!
Heatmaps show you an aggregated view of all clicks and mouse movements from your user tests, bringing another level of analysis into the performance of designs. You can also easily download heatmaps and share your results; ideal when presenting your research with stakeholders.
Insights you can gain from heatmaps:
- Visualise all clicks and movements on your designs
- Discover which CTA buttons are being clicked the most
- See what elements in your design get the most attention
Heatmaps are available on all existing user test projects but if you’re creating your first one, it’s easy to get started.
Creating your test and inviting participants
- Go to your dashboard
- Click on Create Project
- Click User Test
- Enter a name for the project
- Click Pick a project to select the prototype you wish to test
- Select either Free Roam or Goal-based test
- Click Invite participants
- Click Copy to share the link to your test or click Send email
Participants can take the test in browser or on their mobile or tablet device. They’ll navigate throughout the prototype, and leave audio and video feedback as they go. Once the test has been completed, you’ll find the result ready to watch and share with your team in Marvel.
Viewing heatmaps
Heatmaps are automatically generated as soon as you start gathering test results. Simply click on the ‘Heatmaps’ tab in your user test project to view.
Want to hear all about the latest features in Marvel? Join one of our weekly webinars as we demo what’s new and answer any of your questions in our interactive q&a.


